Last week, the stock market did something it has never done before. And it could mean an enormous, face-melting stock market rebound rally is on the way.
Two Thursdays ago – on January 12 – the stock market fired off an unprecedented triple buy signal.
That is, on that day, three major, ultra-rare, ultra-predictive stock market breadth thrust signals were all triggered – the Breakaway Momentum, Whaley Breadth Thrust, and Triple 70 Thrust indicators.
The Breakaway Momentum indicator compares the number of advancing stocks to the number of declining stocks in the market over a 10-day period. And it’s triggered when the amount of advancing stocks outnumbers declining stocks by about 2-to-1. This is very rare and usually only happens when bear markets are ending and bull markets are starting.
The Whaley Breadth Thrust indicator is similar. It compares the number of advancing stocks to the number of declining stocks in the market over a five-day period. And it’s triggered when the amount of advancing stocks outnumbers declining stocks by about 3-to-1. This, too, is very rare and usually only happens when bear markets are ending and bull markets are starting.
The Triple 70 Thrust indicator was also triggered. This happens when the percentage of rising stocks in the market exceeds 70% for three consecutive days. This is also a rare indicator, and it also tends to mark the start of a new bull market.
All three ultra-rare, ultra-predictive “bear market ending” technical indicators flashed just 9 days ago.
That’s the first time ever that all three have flashed on the same day.
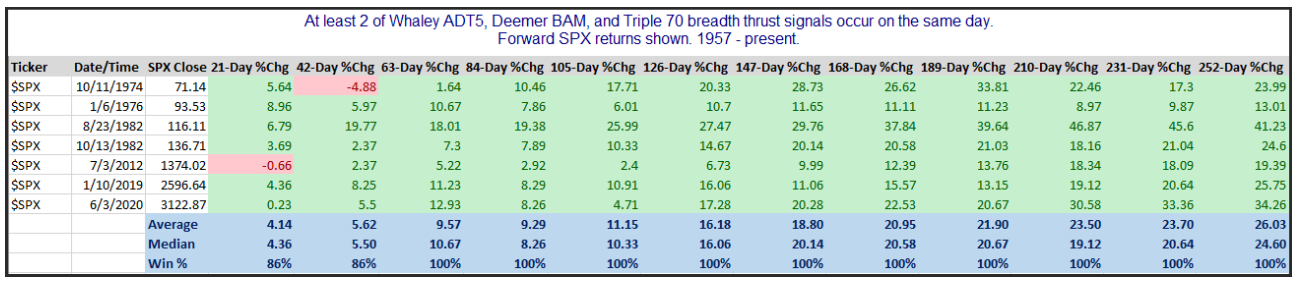
In the past, we’ve only had instances where two of the three were triggered at the same time. And that has happened just seven times since World War II.
In all seven instances, the stock market was higher three, six, nine, and 12 months later.
The average return 12 months later? 26%. The smallest return 12 months later? 13%.
History is pretty clear here. We have a 100% accurate precedent for what just happened, and it signals a massive stock market surge over the next year.
The Perfect Opportunity to Buy Stocks
To be sure, it’s not up, up, and away for stocks immediately after these technical indicators get triggered.
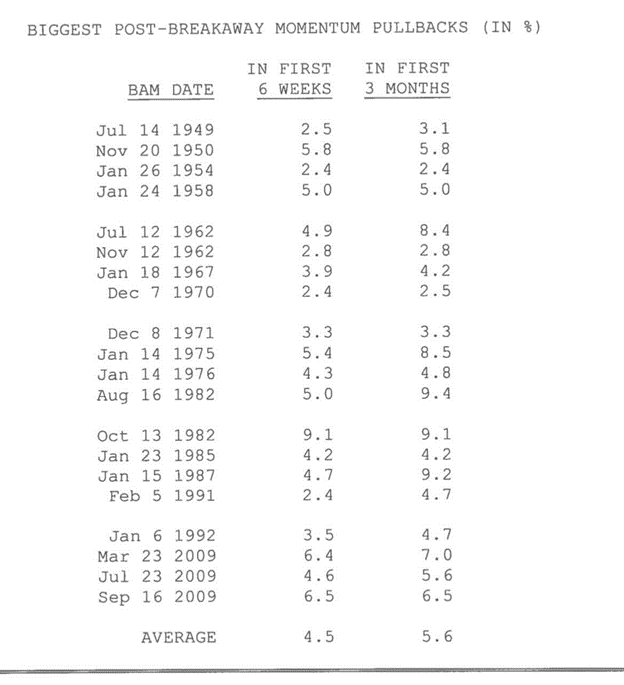
In fact, stocks always pull back first before the real rally gets started. For example, every time the Breakaway Momentum indicator has been triggered since World War II, stocks suffered a short-term pullback of at least 2% – and, on average, 4% – over the following few weeks.
Then, they soared.
So, if you’re looking for the ultimate buying opportunity…
You don’t want to buy stocks right after the Breakaway Momentum indicator flashes, as it did nine days ago.
You want to buy stocks after they drop 2%-plus following a Breakaway Momentum trigger – before they turn around and fly higher.
That’s happening right now.
The Final Word
Last Thursday, the stock market triggered a Breakaway Momentum signal. It rallied for a few days, then dropped about 3% – consistent with historical standards.
Then, yesterday, stocks took off like a rocket ship.
This is the ultimate buy signal we’ve been waiting for.
Breakaway Momentum was triggered. Stocks pulled back. They stabilized. Then they bounced back.
History says now is the perfect time to buy before a massive stock market surge over the next 12 months.
And we have the perfect tool to help you buy the best stocks for this market melt-up.
Over the past year, my team and I have developed a proprietary quantitative stock-picking tool designed specifically to identify breakout stocks – before they break out.
It has already spotted dozens of stocks that have soared more than 100% over the past few months alone.
And that was all during a bear market. Just imagine what it will be able to do when the markets start surging higher in 2023.
So…
If you’ve been waiting for the perfect opportunity to buy the dip…
And you’ve been looking for the perfect stocks to buy on the dip…
Look no further. We may have the answer for you.
On the date of publication, Luke Lango did not have (either directly or indirectly) any positions in the securities mentioned in this article.